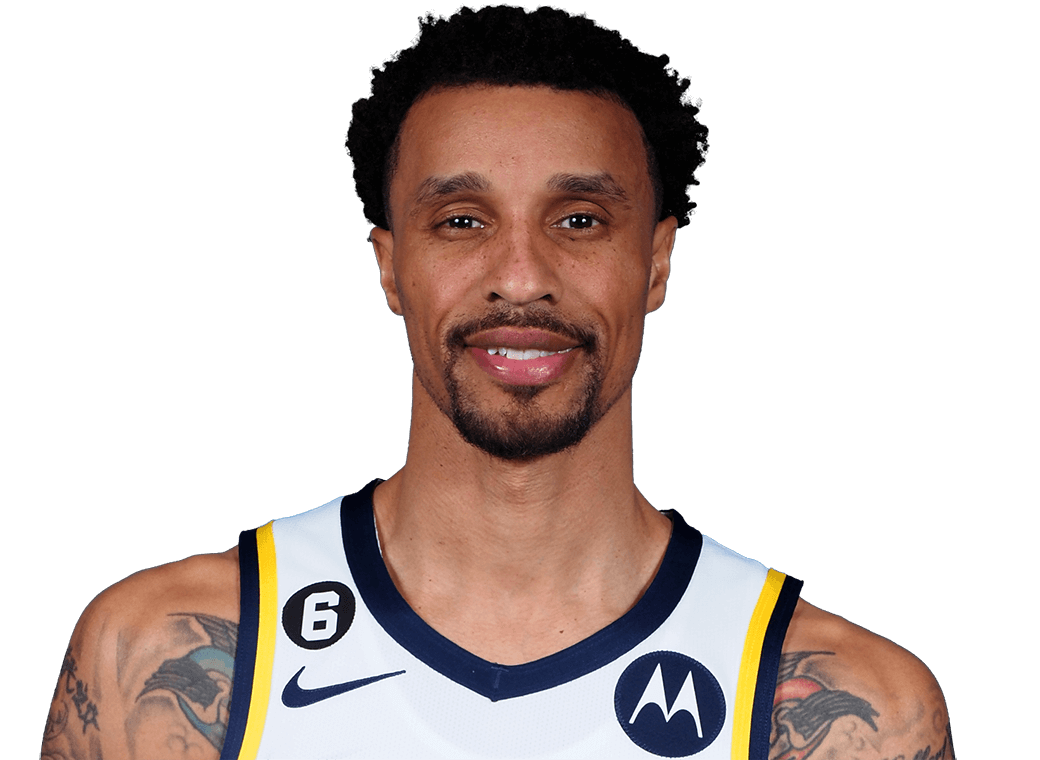
guard
6-4, 188 poundsAge 40Indiana-Purdue IndianapolisNo. 26 pick, 200815th season
| Season | Team | GP | MIN | PTS | REB | AST | STL | BLK | TO | FG% | 3PM | 3P% | FT% | TS% | +/− |
|---|---|---|---|---|---|---|---|---|---|---|---|---|---|---|---|
| 2015-16IND | IND | 74 | 34.1 | 12.1 | 4.0 | 3.5 | 1.1 | 0.2 | 1.4 | .441 | 1.7 | .408 | .760 | .555 | +1.3 |
| 2016-17UTA | UTA | 49 | 31.5 | 16.9 | 3.4 | 4.2 | 1.0 | 0.2 | 1.7 | .477 | 1.9 | .403 | .801 | .599 | +5.3 |
| 2017-182 teams | 2 teams | 67 | 27.0 | 10.0 | 2.7 | 2.8 | 0.9 | 0.4 | 1.3 | .460 | 1.3 | .415 | .786 | .580 | −1.9 |
| SAC | SAC | 43 | 26.6 | 10.3 | 2.7 | 2.8 | 0.9 | 0.3 | 1.4 | .469 | 1.3 | .453 | .778 | .597 | −5.7 |
| CLE | CLE | 24 | 27.9 | 9.4 | 2.7 | 2.8 | 0.9 | 0.6 | 1.2 | .444 | 1.1 | .351 | .805 | .551 | +5.0 |
| 2018-192 teams | 2 teams | 60 | 21.7 | 7.6 | 2.5 | 2.3 | 0.9 | 0.1 | 0.8 | .452 | 0.8 | .314 | .824 | .554 | +2.5 |
| CLE | CLE | 13 | 26.5 | 10.8 | 2.1 | 2.8 | 0.9 | 0.1 | 1.5 | .514 | 1.0 | .464 | .850 | .604 | −3.4 |
| MIL | MIL | 47 | 20.4 | 6.8 | 2.6 | 2.1 | 0.9 | 0.1 | 0.7 | .428 | 0.7 | .280 | .815 | .534 | +4.1 |
| 2019-20MIL | MIL | 59 | 21.5 | 9.4 | 3.0 | 3.1 | 0.8 | 0.1 | 1.0 | .516 | 1.4 | .460 | .842 | .659 | +5.1 |
| 2020-212 teams | 2 teams | 30 | 22.4 | 8.7 | 2.0 | 2.4 | 0.8 | 0.2 | 1.0 | .482 | 1.0 | .388 | .800 | .596 | −0.3 |
| OKC | OKC | 14 | 26.3 | 11.8 | 2.1 | 3.1 | 0.9 | 0.1 | 0.9 | .508 | 1.6 | .386 | .840 | .630 | −1.1 |
| PHI | PHI | 16 | 18.9 | 6.0 | 2.0 | 1.9 | 0.7 | 0.2 | 1.2 | .442 | 0.6 | .391 | .760 | .545 | +0.4 |
| 2021-22MIL | MIL | 54 | 23.2 | 6.2 | 2.9 | 2.2 | 0.8 | 0.1 | 0.8 | .429 | 0.8 | .306 | .919 | .552 | +5.7 |
| 2022-232 teams | 2 teams | 46 | 18.1 | 5.0 | 1.8 | 2.4 | 0.6 | 0.1 | 0.7 | .470 | 0.7 | .358 | .764 | .610 | +0.9 |
| MIL | MIL | 35 | 19.1 | 5.0 | 1.9 | 2.5 | 0.5 | 0.1 | 0.8 | .447 | 0.7 | .311 | .739 | .575 | +0.5 |
| IND | IND | 11 | 15.1 | 5.2 | 1.6 | 1.9 | 0.6 | 0.3 | 0.6 | .559 | 1.0 | .524 | .889 | .751 | +2.1 |
| Career8 seasons | 8 seasons | 439 | 25.5 | 9.6 | 2.9 | 2.9 | 0.9 | 0.2 | 1.1 | .464 | 1.2 | .390 | .805 | .585 | +2.3 |
Blue: his best season in each column (20 games or more, four in the playoffs; 3P% with two tries a game, FT% with one).
| Source | Hill | NBA avg |
|---|---|---|
| Paint | 29.3% | 44.0% |
| Mid-range | 8.6% | 7.7% |
| Threes | 44.0% | 32.3% |
| Free throws | 18.1% | 16.0% |
| Fast break | 14.2% | 12.2% |
| Off turnovers | 11.2% | 14.8% |
| Unassisted makes | 35.9% | 39.7% |
| Usage rate | 11.0% | |
|---|---|---|
| Assist rate | 17.8% | |
| Assists per turnover | 3.24 | |
| Turnover rate (per 100 plays) | 10.2 | |
| Offensive rating | 108.8 | |
| Defensive rating | 106.9 | |
| Net rating | +1.9 | |
| Offensive rebound rate | 1.7% | |
| Defensive rebound rate | 7.7% | |
| Effective FG% | 57.2% | |
| Fouls drawn a game | 1.2 |
Not ranked: NBA ranks need 58+ games, and he has played 46.
| Zone | Share of shots | Hill | NBA | FG% | NBA FG% |
|---|---|---|---|---|---|
| At the rim | 23.5% | 29.9% | 71.8% | 66.6% | |
| Paint (non-rim) | 9.0% | 19.5% | 40.0% | 44.4% | |
| Mid-range | 10.8% | 11.9% |
| Stat | Avg | NBA rank |
|---|---|---|
| Deflections | 1.0 | |
| Contested shots | 2.6 | |
| Twos contested | 1.5 | |
| Threes contested | 1.1 | |
| Charges drawn | 0.00 | |
| Loose balls recovered | 0.4 | |
| Box outs | 0.2 | |
| Screen assists | 0.1 | |
| Points from screen assists | 0.3 |
| Per game | Hill | NBA avg |
|---|---|---|
| Distance (miles) | 1.30 | 1.92 |
| Average speed (mph) | 4.10 | 4.17 |
| Touches | 31.7 | 43.5 |
| Passes | 25.5 | 30.3 |
| Potential assists | 4.1 | 4.9 |
| Secondary assists | 0.2 | 0.4 |
| Offensive rebound chances | 1.3 | 2.7 |
| Defensive rebound chances | 3.3 | 6.0 |
| Stat | Hill | NBA avg |
|---|---|---|
| Rim shots defended per game |
| Split | GP | Pts | Reb | Ast | FG% | 3P% | FT% | TS% | +/− |
|---|---|---|---|---|---|---|---|---|---|
| Location | |||||||||
| Home | 26 | 4.5 | 2.0 | 2.4 | 47.5% | 35.4% | 75.0% | 62.2% | +0.7 |
| Away | 20 | 5.8 | 1.6 | 2.4 | 46.5% | 36.2% | 78.3% | 59.8% | +1.1 |
| Result | |||||||||
| 55.6% |
| 42.0% |
| Corner three | 20.5% | 9.7% | 41.2% | 38.5% |
|---|
| Above-break three | 33.7% | 28.8% | 33.9% | 35.5% |
|---|
| Date | Opp | Result | Min | Pts | Reb | Ast | FG | 3P | FT | TO | +/− |
|---|---|---|---|---|---|---|---|---|---|---|---|
| Apr 9 | @ NYK | W141–136 | 21:56 | 17 | 3 | 3 | 5–7 | 5–6 | 2–3 | 1 | +29 |
| Apr 7 | vs DET | L115–122 | 17:55 | 9 | 1 | 5 | 3–5 | 1–2 | 2–2 | 1 | −17 |
| Mar 29 | vs MIL | L136–149 | 13:57 | 2 | 0 | 1 | 0–0 | 0–0 | 2–2 | 0 | 0 |
| Mar 27 | vs DAL | L104–127 | 5:52 | 0 | 1 | 0 | 0–0 | 0–0 | 0–0 | 0 | −14 |
| Mar 24 | @ BOS | L95–120 | 7:22 | 0 | 1 | 2 | 0–1 | 0–1 | 0–0 | 0 | +1 |
| Mar 18 | vs PHI | L121–141 | 18:09 | 0 | 4 | 1 | 0–3 | 0–3 | 0–0 | 1 | −2 |
| Mar 16 | @ MIL | W139–123 | 23:17 | 15 | 2 | 2 | 5–6 | 3–4 | 2–2 | 0 | +26 |
| Mar 13 | @ DET | L97–117 | 15:27 | 3 | 1 | 2 | 1–4 | 1–2 | 0–0 | 1 | −8 |
| Mar 11 | @ DET | W121–115 | 17:47 | 4 | 4 | 5 | 2–4 | 0–1 | 0–0 | 3 | +18 |
| Mar 2 | @ SAS | L99–110 | 14:58 | 7 | 1 | 0 | 3–4 | 1–2 | 0–0 | 0 | −8 |
| 7:22 |
| 0 |
| 1 |
| 2 |
| 1 |
| 0 |
| 0–1 |
| 0–1 |
| 0–0 |
| 0 |
| 1 |
| +1 |
| Mar 18 | vs PHI | L121–141 | 18:09 | 0 | 4 | 1 | 0 | 1 | 0–3 | 0–3 | 0–0 | 1 | 2 | −2 |
| Mar 16 | @ MIL | W139–123 | 23:17 | 15 | 2 | 2 | 1 | 1 | 5–6 | 3–4 | 2–2 | 0 | 2 | +26 |
| Mar 13 | @ DET | L97–117 | 15:27 | 3 | 1 | 2 | 0 | 0 | 1–4 | 1–2 | 0–0 | 1 | 0 | −8 |
| Mar 11 | @ DET | W121–115 | 17:47 | 4 | 4 | 5 | 1 | 0 | 2–4 | 0–1 | 0–0 | 3 | 1 | +18 |
| Mar 2 | @ SAS | L99–110 | 14:58 | 7 | 1 | 0 | 1 | 1 | 3–4 | 1–2 | 0–0 | 0 | 2 | −8 |
| Feb 13 | vs UTA | L117–123 | 9:36 | 0 | 0 | 0 | 1 | 0 | 0–0 | 0–0 | 0–0 | 0 | 0 | −2 |
| Feb 2 | vs LAC | W106–105 | 1:17 | 0 | 0 | 0 | 0 | 0 | 0–0 | 0–0 | 0–0 | 0 | 0 | +6 |
| Jan 21 | @ CLE | L102–114 | 17:44 | 5 | 1 | 2 | 1 | 0 | 1–3 | 1–3 | 2–2 | 0 | 1 | −14 |
| Jan 17 | vs TOR | W130–122 | 13:38 | 5 | 0 | 1 | 0 | 0 | 2–4 | 1–3 | 0–0 | 0 | 1 | −13 |
| Jan 16 | vs IND | W132–119 | 22:28 | 9 | 0 | 6 | 3 | 0 | 4–6 | 1–3 | 0–0 | 0 | 2 | +2 |
| Jan 6 | vs CHA | L109–138 | 12:00 | 5 | 2 | 3 | 1 | 0 | 2–2 | 1–1 | 0–0 | 0 | 0 | −4 |
| Dec 28 | @ CHI | L113–119 | 28:21 | 8 | 1 | 1 | 2 | 0 | 3–7 | 0–4 | 2–2 | 1 | 3 | −4 |
| Dec 17 | vs UTA | W123–97 | 16:39 | 9 | 5 | 3 | 1 | 0 | 3–4 | 1–2 | 2–2 | 3 | 1 | +12 |
| Dec 15 | @ MEM | L101–142 | 20:02 | 5 | 3 | 5 | 0 | 0 | 2–7 | 1–6 | 0–0 | 0 | 1 | −20 |
| Dec 13 | vs GSW | W128–111 | 19:02 | 5 | 5 | 3 | 1 | 0 | 1–1 | 1–1 | 2–2 | 3 | 1 | +3 |
| Dec 11 | @ HOU | L92–97 | 13:47 | 0 | 2 | 1 | 0 | 0 | 0–0 | 0–0 | 0–0 | 1 | 0 | −11 |
| Dec 9 | @ DAL | W106–105 | 21:01 | 6 | 3 | 4 | 0 | 0 | 2–3 | 2–3 | 0–0 | 1 | 0 | +9 |
| Dec 7 | vs SAC | W126–113 | 13:56 | 3 | 2 | 3 | 0 | 0 | 1–4 | 1–3 | 0–0 | 0 | 1 | 0 |
| Dec 5 | @ ORL | W109–102 | 18:52 | 0 | 1 | 2 | 1 | 0 | 0–1 | 0–1 | 0–0 | 0 | 0 | +2 |
| Dec 3 | @ CHA | W105–96 | 25:59 | 8 | 2 | 5 | 1 | 0 | 4–7 | 0–0 | 0–0 | 4 | 2 | +8 |
| Dec 2 | vs LAL | L129–133 | 8:40 | 0 | 1 | 1 | 0 | 0 | 0–0 | 0–0 | 0–0 | 0 | 1 | −1 |
| Nov 30 | @ NYK | W109–103 | 10:21 | 5 | 2 | 1 | 0 | 0 | 2–3 | 0–1 | 1–2 | 0 | 0 | +11 |
| Nov 27 | vs DAL | W124–115 | 15:22 | 5 | 2 | 2 | 0 | 0 | 2–2 | 1–1 | 0–0 | 1 | 2 | 0 |
| Nov 25 | vs CLE | W117–102 | 20:02 | 5 | 2 | 2 | 0 | 0 | 2–5 | 1–3 | 0–2 | 1 | 2 | +4 |
| Nov 23 | vs CHI | L113–118 | 17:28 | 10 | 1 | 0 | 0 | 0 | 3–7 | 2–4 | 2–2 | 0 | 0 | −13 |
| Nov 21 | vs POR | W119–111 | 19:45 | 0 | 5 | 5 | 2 | 1 | 0–1 | 0–1 | 0–0 | 0 | 0 | +5 |
| Nov 18 | @ PHI | L102–110 | 13:53 | 7 | 0 | 2 | 1 | 0 | 2–5 | 2–4 | 1–2 | 0 | 1 | −1 |
| Nov 16 | vs CLE | W113–98 | 18:59 | 7 | 3 | 3 | 0 | 0 | 3–6 | 1–4 | 0–0 | 2 | 4 | −5 |
| Nov 14 | vs ATL | L106–121 | 25:53 | 2 | 3 | 3 | 0 | 1 | 0–1 | 0–0 | 2–2 | 2 | 0 | −3 |
| Nov 11 | @ SAS | L93–111 | 27:39 | 5 | 2 | 4 | 0 | 1 | 1–9 | 0–5 | 3–4 | 1 | 1 | −1 |
| Nov 9 | @ OKC | W136–132 | 35:24 | 12 | 2 | 5 | 3 | 0 | 3–6 | 1–1 | 5–6 | 1 | 1 | −4 |
| Nov 7 | @ ATL | L98–117 | 16:46 | 2 | 0 | 0 | 0 | 0 | 1–4 | 0–2 | 0–0 | 0 | 0 | −8 |
| Nov 5 | vs OKC | W108–94 | 21:12 | 2 | 2 | 2 | 0 | 0 | 1–2 | 0–0 | 0–2 | 3 | 3 | +17 |
| Nov 4 | @ MIN | W115–102 | 17:52 | 2 | 0 | 1 | 1 | 0 | 1–3 | 0–1 | 0–0 | 0 | 0 | −5 |
| Nov 2 | vs DET | W116–91 | 18:21 | 7 | 4 | 3 | 0 | 0 | 2–6 | 1–3 | 2–3 | 0 | 1 | +6 |
| Oct 31 | vs DET | W110–108 | 17:27 | 3 | 1 | 2 | 0 | 0 | 0–3 | 0–3 | 3–4 | 0 | 1 | −10 |
| Oct 29 | vs ATL | W123–115 | 16:37 | 0 | 0 | 2 | 0 | 0 | 0–1 | 0–1 | 0–0 | 0 | 2 | +9 |
| Oct 28 | vs NYK | W119–108 | 26:37 | 12 | 4 | 2 | 0 | 0 | 4–10 | 2–6 | 2–3 | 0 | 2 | +6 |
| Oct 26 | vs BKN | W110–99 | 29:48 | 8 | 3 | 4 | 1 | 0 | 2–3 | 0–1 | 4–4 | 1 | 3 | +12 |
| Oct 22 | vs HOU | W125–105 | 23:39 | 9 | 2 | 6 | 0 | 0 | 3–4 | 2–3 | 1–2 | 0 | 2 | +20 |
| Oct 20 | @ PHI | W90–88 | 20:33 | 4 | 1 | 0 | 0 | 0 | 2–2 | 0–0 | 0–0 | 2 | 2 | +3 |
| Distance | Made–Att | Share | NBA | FG% | NBA FG% |
|---|
| Under 8 ft | 29–47 | 28.3% | 41.4% | 61.7% | 60.2% |
|---|---|---|---|---|---|
| 8–16 ft | 8–13 | 7.8% | 13.5% | 61.5% | 44.6% |
| 16–24 ft | 7–12 | 7.2% | 6.4% | 58.3% | 41.4% |
| 24+ ft | 33–89 | 53.6% | 38.5% | 37.1% | 36.2% |
| Backcourt | 1–5 | 3.0% | 0.2% | 20.0% | 3.3% |
| Type | Made–Att | Share | NBA | FG% | NBA FG% |
|---|---|---|---|---|---|
| Dunks | 3–3 | 1.8% | 6.0% | 100.0% | 89.2% |
| Layups | 25–42 | 25.3% | 27.1% | 59.5% | 57.3% |
| Floaters | 10–14 | 8.4% | 8.7% | 71.4% | 45.8% |
| Hooks | 0–1 | 0.6% | 3.1% | 0.0% | 49.2% |
| Pull-up jumpers | 9–28 | 16.9% | 13.7% | 32.1% | 39.7% |
| Step-backs | 1–3 | 1.8% | 4.8% | 33.3% | 39.0% |
| Turnarounds and fadeaways | 0–0 | 0.0% | 4.9% | — | 42.9% |
| Other jump shots | 30–75 | 45.2% | 31.7% | 40.0% | 37.0% |
| 1.3 |
| 2.9 |
| Opponent FG% at the rim | 71.2% | 67.9% |
|---|
NBA avg is the average of the 245 qualified players (58+ games).
| Games | Min | Pts | FG | FG% | 3P | FT | +/− |
|---|---|---|---|---|---|---|---|
| 10 | 22.6 | 4 | 1–1 | 100.0% | 1–1 | 1–2 | +4 |
Clutch samples are small, so they are not ranked.
| Wins | 27 | 6.0 | 2.2 | 2.9 | 53.8% | 42.9% | 70.3% | 67.3% | +6.3 |
|---|
| Losses | 19 | 3.7 | 1.3 | 1.7 | 35.5% | 25.6% | 88.9% | 50.1% | −6.8 |
|---|
| Month | |||||||||
|---|---|---|---|---|---|---|---|---|---|
| Oct | 6 | 6.0 | 1.8 | 2.7 | 47.8% | 28.6% | 76.9% | 62.7% | +6.7 |
| Nov | 14 | 5.1 | 2.0 | 2.4 | 38.3% | 30.0% | 64.0% | 50.0% | +0.2 |
| Dec | 10 | 4.4 | 2.5 | 2.8 | 47.1% | 30.0% | 100.0% | 60.0% | −0.2 |
| Jan | 4 | 6.0 | 0.8 | 3.0 | 60.0% | 40.0% | 100.0% | 75.6% | −7.3 |
| Feb | 2 | 0.0 | 0.0 | 0.0 | — | — | — | — | +2.0 |
| Mar | 8 | 3.9 | 1.8 | 1.6 | 50.0% | 38.5% | 100.0% | 65.2% | +1.6 |
| Apr | 2 | 13.0 | 2.0 | 4.0 | 66.7% | 75.0% | 80.0% | 91.5% | +6.0 |
NBA Cup semifinals count as neutral-site games, as on NBA.com.
| Game | Points | Shooting | Possessions |
|---|---|---|---|
| Jan. 17, 2023 | 0 | 0-0 | 4.2 |
| Jan. 15, 2022 | 2 | 1-3 | 17.0 |
| Dec. 2, 2021 | 0 | 0-1 | 14.9 |
| Feb. 25, 2020 | 2 | 0-1 | 18.0 |
| Nov. 2, 2019 | 2 | 1-1 | 15.9 |
| May 25, 2019 | 2 | 1-2 | 15.4 |
| May 23, 2019 | 2 | 1-1 | 16.5 |
| May 21, 2019 | 0 | 0-0 | 14.3 |
| May 19, 2019 | 6 | 2-2 | 22.0 |
| May 17, 2019 | 4 | 1-3 | 15.1 |
| May 15, 2019 | 0 | 0-1 | 8.3 |
| Jan. 31, 2019 | 2 | 0-1 | 15.0 |
| Jan. 5, 2019 | 2 | 0-0 | 16.5 |
| Dec. 1, 2018 | 1 | 0-0 | 3.1 |
| Oct. 17, 2018 | 1 | 0-1 | 6.8 |
| May 7, 2018 | 0 | 0-1 | 8.8 |
| May 5, 2018 | 0 | 0-3 | 24.8 |
| May 3, 2018 | 0 | 0-2 | 17.6 |
| May 1, 2018 | 0 | 0-0 | 7.2 |
| March 21, 2018 | 5 | 2-2 | 18.1 |
| Dec. 17, 2017 | 0 | 0-0 | 9.1 |
| Game | Points | Shooting | Possessions |
|---|---|---|---|
| Jan. 6, 2023 | 0 | 0-0 | 7.6 |
| Dec. 3, 2022 | 6 | 2-4 | 17.3 |
| Dec. 1, 2021 | 2 | 1-3 | 29.9 |
| Dec. 26, 2020 | 0 | 0-1 | 14.0 |
| March 1, 2020 | 2 | 1-2 | 13.8 |
| Nov. 30, 2019 | 3 | 1-1 | 1.1 |
| May 8, 2019 | 3 | 1-1 | 9.2 |
| May 6, 2019 | 0 | 0-0 | 2.0 |
| May 3, 2019 | 0 | 0-1 | 1.5 |
| April 30, 2019 | 2 | 0-2 | 4.4 |
| April 28, 2019 | 2 | 1-1 | 1.9 |
| Feb. 21, 2019 | 0 | 0-1 | 3.2 |
The NBA’s matchup counts: possessions one man guarded another, and the points and shots that came of them. Usual is a scorer’s rate on everyone else who guarded him in the same years. Ranked with 250 possessions or more, about four full games of one man on the other, and a long record counts for more than a short one.
| Dec. 21, 2018 | 0 | 0-3 | 15.2 |
|---|
| May 27, 2018 | 0 | 0-4 | 26.1 |
|---|
| May 25, 2018 | 5 | 2-3 | 26.5 |
|---|
| May 23, 2018 | 3 | 1-2 | 20.0 |
|---|
| May 21, 2018 | 5 | 2-5 | 35.9 |
|---|
| May 19, 2018 | 6 | 3-7 | 30.5 |
|---|
| May 15, 2018 | 8 | 3-4 | 33.2 |
|---|
| May 13, 2018 | 2 | 1-4 | 24.1 |
|---|
| Feb. 11, 2018 | 0 | 0-2 | 10.5 |
|---|
| Game | Points | Shooting | Possessions |
|---|---|---|---|
| Oct. 21, 2021 | 3 | 1-4 | 18.1 |
| Feb. 25, 2020 | 2 | 1-3 | 13.4 |
| Nov. 2, 2019 | 9 | 4-7 | 30.3 |
| May 25, 2019 | 0 | 0-0 | 26.4 |
| May 23, 2019 | 0 | 0-0 | 11.4 |
| May 21, 2019 | 8 | 2-3 | 21.9 |
| May 19, 2019 | 0 | 0-0 | 14.4 |
| May 17, 2019 | 1 | 0-4 | 28.8 |
| May 15, 2019 | 4 | 1-2 | 25.9 |
| Jan. 31, 2019 | 0 | 0-1 | 16.6 |
| Oct. 17, 2018 | 8 | 3-3 | 28.6 |
| May 7, 2018 | 2 | 1-4 | 35.9 |
| May 5, 2018 | 6 | 2-4 | 45.3 |
| May 3, 2018 | 3 | 1-2 | 29.7 |
| May 1, 2018 | 8 | 3-4 | 29.2 |
| March 21, 2018 | 10 | 3-3 | 35.6 |
| Dec. 17, 2017 | 3 | 1-2 | 26.1 |
| Game | Points | Shooting | Possessions |
|---|---|---|---|
| March 27, 2023 | 2 | 1-1 | 1.3 |
| Oct. 26, 2022 | 2 | 0-4 | 27.3 |
| March 31, 2022 | 8 | 2-3 | 9.7 |
| Jan. 18, 2020 | 2 | 1-3 | 15.1 |
| May 8, 2019 | 0 | 0-2 | 12.3 |
| May 6, 2019 | 4 | 1-6 | 28.8 |
| May 3, 2019 | 4 | 1-5 | 33.6 |
| April 30, 2019 | 5 | 2-4 | 24.6 |
| April 28, 2019 | 20 | 9-13 | 32.2 |
| Feb. 21, 2019 | 11 | 4-9 | 31.3 |
| Dec. 21, 2018 | 6 | 3-5 | 19.0 |
| Feb. 11, 2018 | 8 | 3-5 | 20.3 |
| Nov. 1, 2017 | 3 | 1-5 | 21.9 |
Season high in 3-pointers (5; his best before, 3). Before this game he averaged 4.8 points, 1.8 rebounds and 2.4 assists in 45 regular-season games.
Hill's assists have risen the most of his numbers this season, to 6.2 per 100 possessions from 4.5.
He's averaging 5.0 points a game, down from 6.2 last season, and his true shooting is 61.0%, up from 55.2%.
He has 19.0% of the Pacers' assists while he's on the floor. Buddy Hield finishes the most of them.
| Zone | Share | Last season | Made | Last season |
|---|---|---|---|---|
| At the rim | 24.1% | 31.0% | 71.8% | 67.1% |
| Rest of the paint | 9.3% | 13.5% | 40.0% | 29.7% |
| Midrange | 11.1% | 6.9% | 55.6% | 47.4% |
| Corner threes | 21.0% | 19.0% | 41.2% | 40.4% |
| Threes above the break | 34.6% | 29.6% | 33.9% | 24.7% |
His shots have moved away from the basket: more from three, 55.6%, up from 48.5%, and fewer at the rim, 24.1%, down from 31.0%. More of his shots are going in: he's 34 for 95 on threes, 35.8%, up from 30.6%, and he's making 62.0% of his twos, up from 54.6%. He's getting to the line more, 33.1 free throws per 100 shots, up from 22.5, and making 76.4% of them.
He's playing 18.1 minutes a game, down from 23.2.
The Pacers have outscored teams by 7.2 points per 100 possessions with him on the floor, 119.4 to 112.2, with garbage time left out. They're minus 4.0 overall.
Lineup numbers leave garbage time out and count points per 100 the NBA’s way; ages are exact, game by game, from 2015-16 on.
