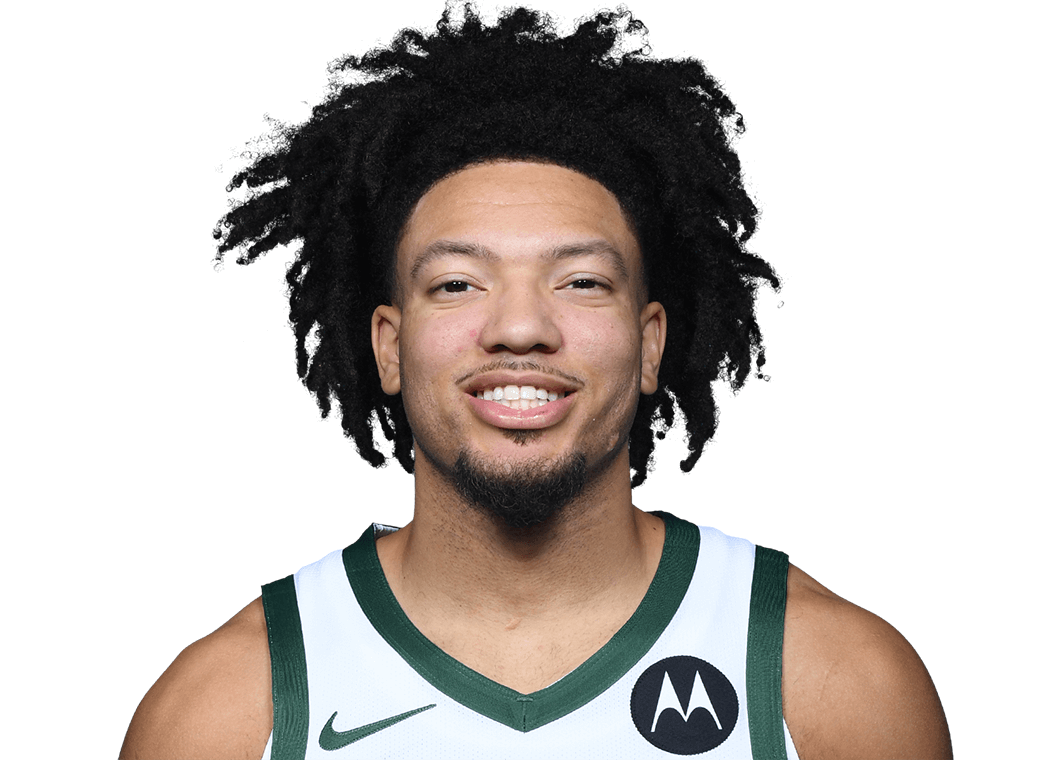
guard
6-0, 185 poundsAge 24AlabamaFirst season
| Season | Team | GP | MIN | PTS | REB | AST | STL | BLK | TO | FG% | 3PM | 3P% | FT% | TS% | +/− |
|---|---|---|---|---|---|---|---|---|---|---|---|---|---|---|---|
| 2025-26MIL | MIL | 7 | 3.7 | 3.1 | 0.3 | 0.3 | 0.0 | 0.0 | 0.6 | .462 | 0.6 | .500 | .750 | .666 | +1.7 |
| Career1 season | 1 season | 7 | 3.7 | 3.1 | 0.3 | 0.3 | 0.0 | 0.0 | 0.6 | .462 | 0.6 | .500 | .750 | .666 | +1.7 |
Blue: his best season in each column (20 games or more, four in the playoffs; 3P% with two tries a game, FT% with one).
| Source | Sears | NBA avg |
|---|---|---|
| Paint | 18.2% | 43.1% |
| Mid-range | 0.0% | 6.5% |
| Threes | 54.5% | 34.5% |
| Free throws | 27.3% | 15.9% |
| Fast break | 0.0% | 13.2% |
| Off turnovers | 36.4% | 15.4% |
| Unassisted makes | 50.0% | 36.3% |
| Usage rate | 34.4% | |
|---|---|---|
| Assist rate | 12.5% | |
| Assists per turnover | 0.50 | |
| Turnover rate (per 100 plays) | 17.4 | |
| Offensive rating | 123.2 | |
| Defensive rating | 101.8 | |
| Net rating | +21.4 | |
| Offensive rebound rate | 5.3% | |
| Defensive rebound rate | 4.5% | |
| Effective FG% | 61.5% | |
| Fouls drawn a game | 0.9 |
Not ranked: NBA ranks need 58+ games, and he has played 7.
| Zone | Share of shots | Sears | NBA | FG% | NBA FG% |
|---|---|---|---|---|---|
| At the rim | 7.7% | 28.4% | 100.0% | 67.1% | |
| Paint (non-rim) | 23.1% | 20.0% | 33.3% | 44.6% | |
| Mid-range | 7.7% | 10.0% |
| Distance | Made–Att | Share | NBA | FG% | NBA FG% |
|---|---|---|---|---|---|
| Under 8 ft | 1–3 | 23.1% | 40.1% | 33.3% | 60.4% |
| 8–16 ft | 1–2 | 15.4% | 13.5% | 50.0% | 44.6% |
| 16–24 ft | 0–0 | 0.0% | 4.9% | — | 40.1% |
| 24+ ft | 4–8 | 61.5% | 41.5% | 50.0% | 36.0% |
| Type | Made–Att | Share | NBA | FG% | NBA FG% |
|---|---|---|---|---|---|
| Dunks | 0–0 | 0.0% | 6.1% | — | 88.6% |
| Layups | 1–1 | 7.7% | 26.4% | 100.0% | 57.2% |
| Floaters | 0–2 | 15.4% | 8.7% | 0.0% | 45.0% |
| Hooks | 0–0 | 0.0% | 2.6% | — | 48.8% |
| Stat | Avg | NBA rank |
|---|---|---|
| Deflections | 0.5 | |
| Contested shots | 1.0 | |
| Twos contested | 0.5 | |
| Threes contested | 0.5 | |
| Charges drawn | 0.00 | |
| Loose balls recovered | 0.3 | |
| Box outs | 0.0 | |
| Screen assists | 0.0 | |
| Points from screen assists | 0.0 |
| Per game | Sears | NBA avg |
|---|---|---|
| Touches | 7.6 | 38.3 |
| Passes | 4.3 | 29.2 |
| Potential assists | 0.7 | 5.0 |
| Secondary assists | 0.1 | 0.5 |
| Offensive rebound chances | 0.5 | 2.1 |
| Defensive rebound chances | 1.0 | 4.7 |
| Stat | Sears | NBA avg |
|---|---|---|
| Rim shots defended per game | 0.1 | 2.3 |
| Opponent FG% at the rim | 0.0% | 65.3% |
NBA avg is the average of the 234 qualified players (58+ games). Distance and speed are left out: NBA.com's tracking for this season has impossible values for many players (some average over 10 mph).
| Split | GP | Pts | Reb | Ast | FG% | 3P% | FT% | TS% | +/− |
|---|---|---|---|---|---|---|---|---|---|
| Location | |||||||||
| Home | 4 | 1.8 | 0.5 | 0.3 | 50.0% | 33.3% | — | 58.3% | +2.5 |
| Away | 3 | 5.0 | 0.0 | 0.3 | 42.9% | 60.0% | 75.0% | 71.3% | +0.7 |
| Result | |||||||||
| 0.0% |
| 41.7% |
| Corner three | 0.0% | 10.8% | — | 38.7% |
|---|
| Above-break three | 61.5% | 30.7% | 50.0% | 35.0% |
|---|
| Date | Opp | Result | Min | Pts | Reb | Ast | FG | 3P | FT | TO | +/− |
|---|---|---|---|---|---|---|---|---|---|---|---|
| Nov 24 | vs POR | L103–115 | 3:18 | 3 | 0 | 0 | 1–3 | 1–2 | 0–0 | 0 | +6 |
| Nov 22 | vs DET | L116–129 | 1:37 | 0 | 1 | 1 | 0–1 | 0–1 | 0–0 | 0 | +6 |
| Nov 15 | vs LAL | L95–119 | 3:05 | 4 | 1 | 0 | 2–2 | 0–0 | 0–0 | 2 | −2 |
| Nov 14 | vs CHA | W147–134 | 0:09 | 0 | 0 | 0 | 0–0 | 0–0 | 0–0 | 0 | 0 |
| Nov 12 | @ CHA | L100–111 | 5:52 | 7 | 0 | 1 | 2–3 | 2–3 | 1–2 | 1 | +7 |
| Nov 4 | @ TOR | L100–128 | 4:41 | 8 | 0 | 0 | 1–3 | 1–2 | 5–6 | 0 | 0 |
| Oct 26 | @ CLE | L113–118 | 7:23 | 0 | 0 | 0 | 0–1 | 0–0 | 0–0 | 1 | −5 |
| 5:52 |
| 7 |
| 0 |
| 1 |
| 0 |
| 0 |
| 2–3 |
| 2–3 |
| 1–2 |
| 1 |
| 1 |
| +7 |
| Nov 4 | @ TOR | L100–128 | 4:41 | 8 | 0 | 0 | 0 | 0 | 1–3 | 1–2 | 5–6 | 0 | 1 | 0 |
| Oct 26 | @ CLE | L113–118 | 7:23 | 0 | 0 | 0 | 0 | 0 | 0–1 | 0–0 | 0–0 | 1 | 1 | −5 |
| Pull-up jumpers | 1–3 | 23.1% | 13.5% | 33.3% | 38.3% |
|---|
| Step-backs | 1–3 | 23.1% | 5.2% | 33.3% | 37.9% |
|---|
| Turnarounds and fadeaways | 0–0 | 0.0% | 5.0% | — | 43.0% |
|---|
| Other jump shots | 3–4 | 30.8% | 32.4% | 75.0% | 37.2% |
|---|
| Wins | 1 | 0.0 | 0.0 | 0.0 | — | — | — | — | 0.0 |
|---|
| Losses | 6 | 3.7 | 0.3 | 0.3 | 46.2% | 50.0% | 75.0% | 66.6% | +2.0 |
|---|
| Month | |||||||||
|---|---|---|---|---|---|---|---|---|---|
| Oct | 1 | 0.0 | 0.0 | 0.0 | 0.0% | — | — | 0.0% | −5.0 |
| Nov | 6 | 3.7 | 0.3 | 0.3 | 50.0% | 50.0% | 75.0% | 70.9% | +2.8 |
NBA Cup semifinals count as neutral-site games, as on NBA.com.
Before this game he averaged 3.2 points, 0.3 rebounds and 0.3 assists in 6 regular-season games.
What changed from last season shows after nine games and 200 minutes.
Lineup numbers leave garbage time out and count points per 100 the NBA’s way; ages are exact, game by game, from 2015-16 on.
